

College Football Hit Rates: How to Read NCAAF Player Props
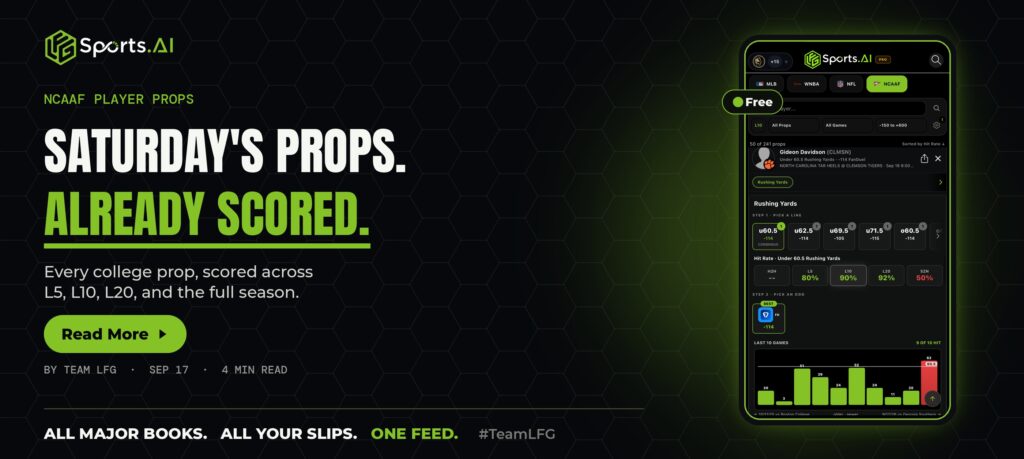
College football props are a different animal. There are 130-plus teams, rosters that turn over every year, and depth charts most bettors have never seen. This makes “does this guy usually clear his number” nearly impossible to eyeball. That gap is exactly what college football hit rates close. This season the app finally covers every Saturday cleanly. Here is how to read NCAAF player props. Additionally, here is the one thing the percentage alone will not tell you.
How College Football Hit Rates Work
A hit rate is the share of a player’s recent games where he cleared a given prop line. For a college running back sitting at under 60.5 rushing yards, an 80 percent last-ten hit rate means he stayed under in eight of his last ten.
LFG scores every NCAAF prop that way and sorts the whole board by it. This way, the props with the strongest recent history rise to the top instead of you guessing at a name you have never heard of. It works the same way it does for any player prop. However, the college slate is where doing it by hand is genuinely impossible.
Read the Windows, Not One Number
LFG does not hand you a single hit rate, it gives you several: head-to-head, last 5, last 10, last 20, and the full season. The spread between them is where the real read lives.
Take a live one. A Clemson back’s under sits at 80 percent over his last 5, 90 percent over his last 10, 92 percent over his last 20, and 50 percent on the season. He has been hot lately, coin flip all year. That gap is a signal, not noise. A number high in every window is a genuine pattern. In contrast, one that is high recently but average on the season is a hot streak that may or may not hold. Read all five, never just the one that looks best.
Look at the Games, Not Just the Percentage
A hit rate quietly hides how the games actually went, so the card charts the last ten and shows each result against the line. Nine green bars and one red that sailed past the number tell you more than “90 percent” ever could.
You see the misses, the blowouts, the one game where he went off, and you decide for yourself whether the recent form is real or a mirage. The transparency is the whole point, because the app shows you the record and lets you make the call.
College Adds Its Own Noise
College football swings harder than the pros. Huge talent gaps, lopsided scores, and starters yanked early in blowouts all mess with a player’s props in ways the NFL rarely does.
A back on a team winning by 40 might sit the fourth quarter and fall short of a number he would have cleared easily. The hit rate captures that history, but you still weigh the spot: the opponent, the spread, whether garbage time is likely. Use the number as your filter. Then, sanity-check the matchup before you fire.
The Takeaway
College football hit rates turn a slate you cannot possibly eyeball into a board you can actually read. Every NCAAF prop is scored across L5, L10, L20, and the season, sorted so the strongest history rises. Read the windows together, look at the actual games, respect the college chaos, and take the best price the card shows you.
The percentage is where you start, not where you stop. A prop that is 90 percent over ten games and 50 percent on the year is telling you two things at once, and the bettors who win read both.
Download LFG Sports AI free on the App Store or Google Play.
LFG Sports AI is a tracking and analytics tool. It does not accept bets or guarantee outcomes. Please bet responsibly.
Every bet you place, in one place.
Sync your sportsbooks, track every prop against the closing number, and see how you really do. Free to start.